
Download the full Dividend Growers Research Report here.
A Google search of “dividends as income” will give us over 57 million results. There are numerous articles describing how to live off dividends, how to make money on dividends, and guides about taxes and dividends. Nowhere on the first page of Google results, however, is there a guide for how to find dividend stocks, let alone stocks that consistently grow their dividends for investors.
This is where TradeSmith can help you. We help you find stocks with strong income potential based on the current health of the stock and consistent dividend growth performance over the past five years. In addition to consistent dividend growth performance, for stocks to be considered for this strategy, they must be in the Stock State Indicator (SSI) Green Zone, have an Average VQ less than 40%, and cannot be trading at a loss since SSI Entry.
Our SSI system works like a stoplight to give insight, at a glance, into the health of a stock. A stock in the Green Zone is behaving normally and is in a healthy state. A stock in the Yellow Zone has corrected from its most recent high, but has not yet hit its stop out signal; it’s still within its normal volatility. And a stock in the Red Zone is behaving erratically and is not in a healthy state.
In analyzing our Dividend Growers method, we back-tested more than 34,000 trades over an average hold time of 363 days.
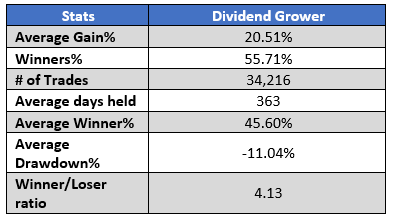
The average winner for this method was sitting at 45.60%. And, this was all accomplished in just under a year! Those are fantastic results, especially for investors looking for some shorter-term gains.
One of the main goals of the Dividend Growers method is to find those trending stocks that pay a dividend yield higher than the S&P 500. So, the positions that our system comes up with through its analysis could be taken as a whole portfolio or as a way to add individual positions to a portfolio to add some diversification.
Now, let’s look at the long-term performance for some individual stocks.
Back in 2009, Hormel Foods triggered an entry Signal for the Dividend Growers. It continued to perform before finally being stopped out in 2016. And, it again triggered another Entry Signal just prior to 2018.
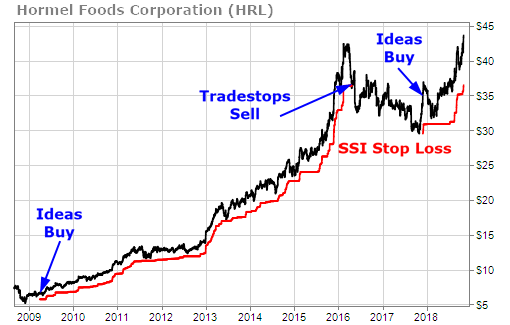
All this happened while the dividends for the stock were continually growing.
When we compare the performance of HRL to the S&P 500, we’re sure you’ll be impressed.
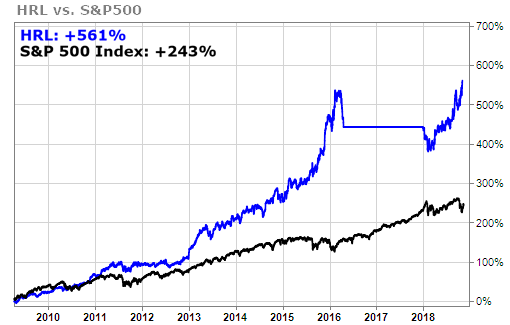
Over the same time period, HRL saw a gain of 561%. Compared to the S&P 500 at 243%, that’s quite the performance. The straight blue line on the chart shows when you would have been out of the trade based on the SSI. The best part is that these gains continued for the stock on its own (meaning profits for investors) while also adding dividends (an extra sort of bonus income from the stock).
Let’s take a look at another popular stock. We’re sure you’ve heard of this one: Microsoft (MSFT).
Our system triggered an Entry signal for MSFT in late 2015. The system still had you in the trade going into late 2018.
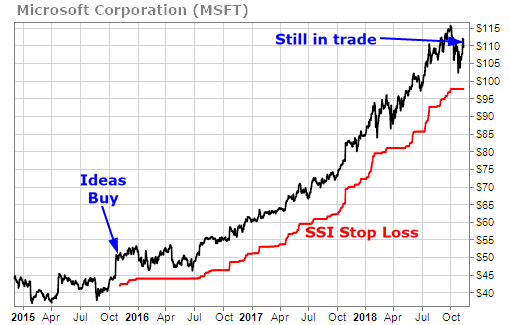
Not once over this time did the stock get stopped out. And, like this strategy’s name suggests, the dividend wasn’t cut for the stock. It went up. In August 2015, the dividend sat at $0.31. In November 2018, the dividend had increased to $0.46. That’s a nice increase!
But again, we want to find those dividend-paying stocks that can outperform the market. Let’s do a quick comparison.
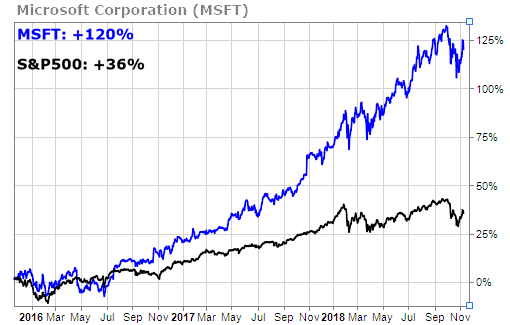
As you can see from the chart above, Microsoft well out-performed the market with a 120% gain, as compared to the S&P 500’s 36% gain.
Finding stocks that consistently grow their dividends can be difficult. Finding those stocks that can outperform the markets can be even harder. With our TradeSmith tools, we make that process a little easier. We conveniently package all the top-performing dividend growers we can find into one, neat location. With a few simple clicks, you, too, can find your next great dividend-growing stock.