
This tool puts you in the driver’s seat. You get to find the best positions for you — based on your own preferences.
You can filter your investments for:
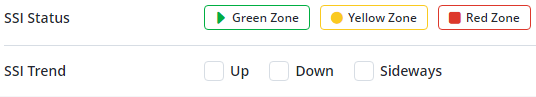
SSI Information
- SSI Status
- Click to select if you want to view SSI Green (healthy), Yellow (Cautionary), or Red (Stopped-Out) positions.
- SSI Trend
- Click to select if you want positions that are in an uptrend, sidetend, or downtrend.
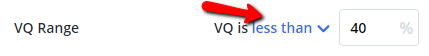
VQ Range
- Choose the volatility range that you’re most comfortable with. Remember, the higher the VQ, the more risk.
- Just type in the number without the percent sign.
- You can click the blue text to toggle between less than, between, and greater than ranges.
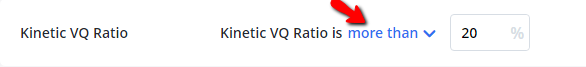
Kinetic VQ Range
- Specify the Kinetic VQ range that you’d like to include.
- Remember, you can adjust the range criteria by clicking the blue words.
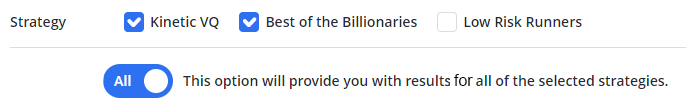
Strategy
-
- Click to select the strategies that you’d like to include.
- If you select more than one strategy, a cross-search will appear.
- The “any” option will provide you with results from any of the strategies you selected. The “all” option will provide you with results from all your selected strategies.
Newsletter Recommendations
- If you have newsletters, you can filter by them.
- Simply change this setting to Yes, and your newsletter recommendations can be used.
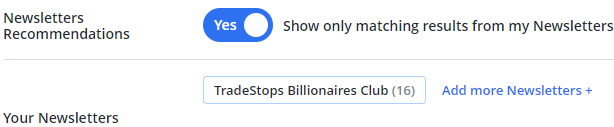
NOTE: if you select “Add more Newsletters,” you can sync your newsletters to Ideas by TradeSmith.
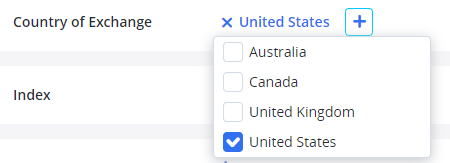
Country of Exchange
- By default, we select the United States as the Country of Exchange.
- Simply select the small, blue + to add additional countries.
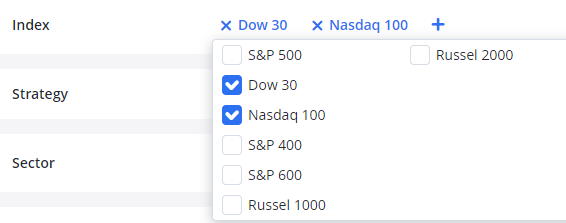
Index
-
- Click the blue “Add Index” text to add some indices.
- Selected indices will have a blue check mark beside them
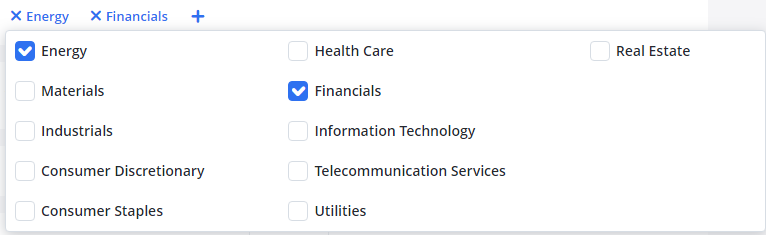
Sector
-
- Choose the sector(s) for your positions.
- Simply click the Add Sector button to see the list of available sectors.
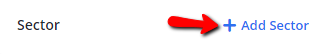
- Click to select the sectors that you want to include.
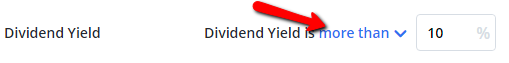
Dividend Yield %
- Type the Dividend Yield percentage that you’re most comfortable with.
- Click the blue text to toggle between less than, between, and greater than ranges.
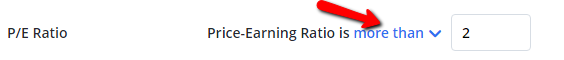
P / E Ratio
- Type the P/E ratio that you’re most comfortable with.
- Click the blue text to toggle between less than, between, and greater than ranges.
Latest Close
- You can specify the latest close price you’d like included.
- Again, you can click the blue words to change the criteria.

Market Cap
- Click to choose if you want to view nano, small, mid, large, or mega cap investments.
![]()
Sort Results
- You can sort your results. Just click the drop-downs to select how you’d like to sort.
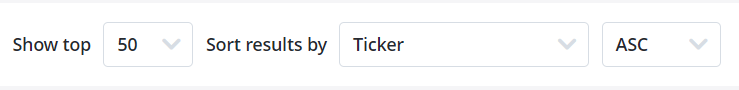
Note: ASC = Ascending and DESC = Descending
Click Calculate Results at the bottom to see your results.
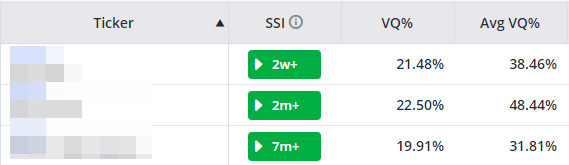
We’ll provide the following information:
- Ticker
- SSI
- VQ information — VQ%, Average VQ, and VQ Ratio
- Newsletters — we’ll show you the newsletters that the position appears in
- Strategies — we’ll show which strategies the positions match
- Volume
- PE Ratio
- Dividend Yield
- Market Cap
- Sector
- Latest Close
- 52 Week High
- 1 year change
Note: You’ll see all the information when you’re logged into your program.
You can click these tickers from within the program to see the market performance and much more.