
Download the full Value Research Report here.
Google defines value stocks as “shares of a company with solid fundamentals that are priced below those of its peers.” When investors realize these hot stocks are undervalued, they jump on them. This can lead to a jump in the stock’s price over a short period of time.
To qualify as a value stock, the following fundamental requirements apply:
- Earnings per share must be positive
- Sales must be positive
- Book value-to-price should be low
But as with any investing decision, there are many options to choose from that require fundamental analysis and a basic knowledge of the stocks’ potential risk or health.
How TradeSmith Helps
TradeSmith can help to streamline that process for you. Our Value method shows you stocks that are in good health based on our algorithms and that match industry best practices, measuring each stock’s fundamentals.
Our algorithms look to the volatility inherent in each stock along with its normal, expected market health. We call these the Volatility Quotient and Stock State Indicators.
Stocks with a lower VQ are said to have lower risk. When screening for value stocks, our system will remove any investment with an average VQ above 40%.
The Stock State Indicators have three levels: Green (healthy), Yellow (correcting), and Red (stopped out). We’ll remove any positions that are not in the SSI Green zone. The investments can also not be trading at a loss since they entered the healthy state.
Let’s See the Results
When we apply our algorithms to qualifying value stocks, the results are fantastic. Some investments could have made gains of more than 1,000%. We’re sure no one would complain about that! In fact, let’s look at one such trade now in Fair Isaac Corp. You know them better as FICO; they’re the ones that run credit scores for customers.
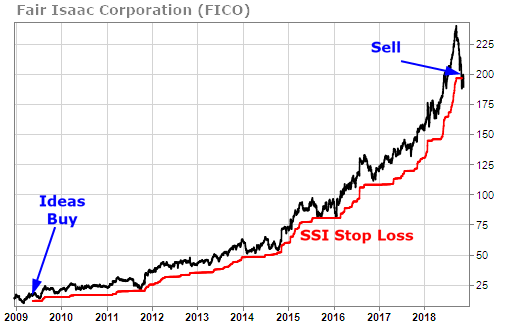
As you can see in the chart above, our system would have signaled an entry point in FICO in mid-2009. The red line on the chart indicates the SSI Red Zone. Remember, the Red Zone indicates the stopping-out price. While FICO came close several times, it didn’t officially get stopped out until close to 2019.
Here’s where the exciting part comes in — the gains.
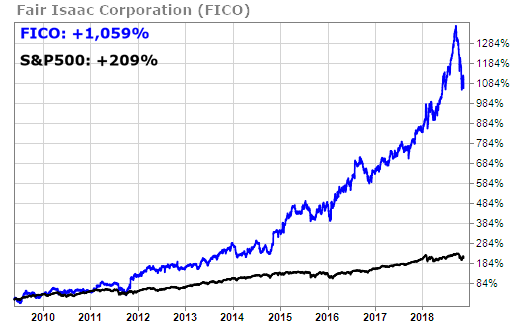
Over this trading period, FICO saw a gain of over 1,000%. Now compare that to the S&P 500’s performance of over 200% during the same time period. Certainly, a nice gain, but by following the Value method, you could have blown these gains out of the water.
Next, we’ll look at an investment that had a smaller, but still quite impressive, gain. It concerns Boston Scientific. They manufacture medical devices used in interventional medical specialties.
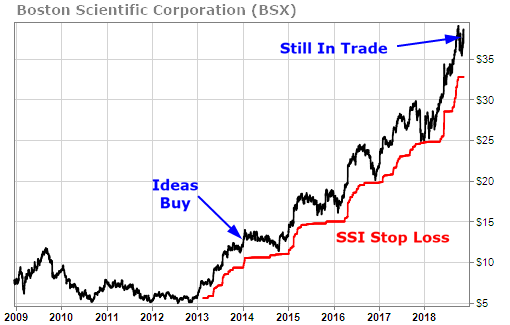
Our system would have signaled an entry point in BSX back in 2014. While BSX nearly reached the stop loss Red Zone price a few times, it managed to come back and trade higher. The upward movement that began in 2018 kept the trade going into 2019.
And here’s the overall performance assessment:

Prior to 2015, BSX traded more or less on par with the S&P 500 before taking off. You can see for yourself how BSX outperformed the S&P 500.
The best part is that this was done over only a short period. You didn’t need to sit on the stock for 10+ years to see nice gains. That’s the beauty of searching for value stocks using our algorithms. You have the potential for quick upside gains while also optimizing for risk and finding healthy stocks.