
Download the full Research Report here.
At TradeSmith, we’re dedicated to advancing our research so that our subscribers may benefit. Many subscribers have asked about trading in the Stock State Indicator (SSI) Yellow Zone. Extensive research and back-testing around that question led us to some exciting results.
Our SSI system works like a stoplight to give insight, at a glance, into the health of a stock. A stock in the Green Zone is behaving normally and is in a healthy state. A stock in the Yellow Zone has corrected from its most recent high but has not yet hit its stop out signal. It’s still within its normal volatility. And a stock in the Red Zone is behaving erratically and is not in a healthy state.
When a stock triggers a new SSI Entry Signal, we know that this is the best time to get into a stock. But, our research found that a stock moving from the SSI Yellow Zone to the SSI Green Zone is also a positive signal.
There are two advantages of investing in a stock when it moves from the SSI Yellow Zone back into the SSI Green Zone.
- A stock in the SSI Yellow Zone is still within its normal range of volatility.
- A stock in the SSI Yellow Zone only has half the downside risk compared to a stock that has just entered the SSI Green Zone for the first time.
A great example of a Low Risk Runner is Intel Corp (INTC). The stock triggered a new SSI Entry Signal in Aug. 2016. Following this, INTC entered the Yellow Zone three times and bounced back higher each time. From July 2017 to May 2018, the stock was up almost 60%, compared with the S&P 500 index, which was only up by 12% at that time.
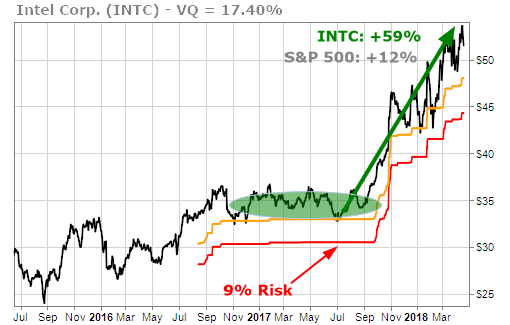
By entering the INTC trade with the Low Risk Runner strategy, there was only 9% risk, rather than the full 17.40% risk based on its VQ. And, because INTC was within its normal range of volatility, it was no surprise to see it move higher in a short amount of time.
In this case, one would exit the trade when INTC triggered an SSI Stop Signal.
Here are a few of the factors we use to identify a Low Risk Runner:
- SSI has recently moved from Yellow Zone back to Green
- Position has an average VQ of less than or equal to 40%
- Stock must be trending up or sideways
With that in mind, there are other exit strategies you can use when building a portfolio based on the Low Risk Runner strategy. One exit strategy relies on time rather than the SSI once a stock re-enters the Green Zone, but it’s not for everyone.
With this strategy, the stop out is based on time, rather than an SSI trailing stop. We would hold the position for 8 months and then exit the trade. Again, due to the potential for a larger drawdown, this strategy is not for everyone. One must be comfortable with taking on more risk.
Let’s look at an example using the 8-month exit strategy.
In Oct. 2016, SVB Financial (SIVB) triggered an Entry Signal. It stayed solidly green until dropping into the SSI Yellow Zone in Aug. 2017 before bouncing back in Sept. 2017.
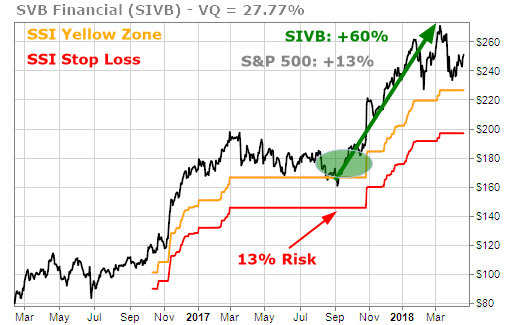
As seen in the chart above, SIVB was up more than 60% over this time while the S&P 500 was up only 13%. It achieved this while also carrying only half the normal risk associated with the position.
Why did we choose 8 months, though? We have completed research to determine how long it takes a stock to move higher by 1 VQ. (For example: If a stock has a VQ of 12%, we wanted to see how long it took the stock to move up by 12%.) Our study found that for most stocks, that time period is six to 10 months.
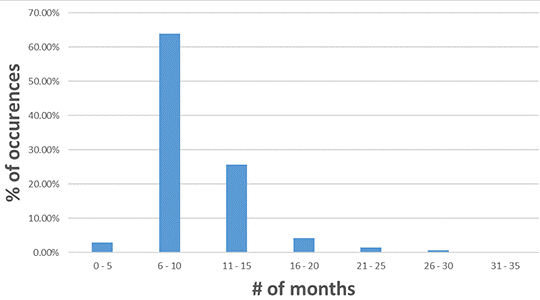
From this data, we chose 8 months as the midpoint to be applied to the Low Risk Runner strategy.
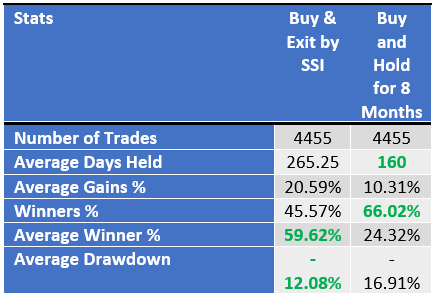
To compare these two strategies, we performed back-testing. The first Low Risk Runner strategy (exiting when the position hits the SSI Red Zone) had almost 46% winning trades. The second strategy (holding for 8 months) had 66% winning trades.
Both provide great performance, but we wanted to take our research a step further. We combined these strategies to see the possible results. In this case, we had two rules for exiting a trade:
- If the stock hits the SSI Red Zone before 8 months, we exit the trade.
- If the stock does not hit its SSI Stop, we exit the trade at the end of 8 months.
It’s a simple methodology, and the maximum hold time is 8 months. It’s a great way to limit risk while also allowing one to take a quick profit without using option trading. The combined strategy maintains the lower drawdowns of the SSI stop method and the shorter holding period of the 8-month exit.
You can see the comparative results of all three methods below.
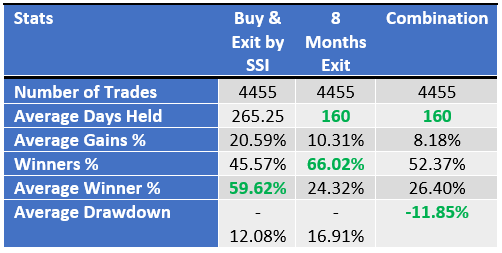
Before choosing one method over the other, consider the benefits and costs:
- Exit by SSI has the biggest average gains, and the average gains really outweigh the average losses. But one most hold positions longer.
- Exit in 8 Months has more winners than losers and shorter holding periods, but the average winner doesn’t nearly outweigh the average loser as well as the Exit by SSI strategy.
- Combining the two strategies (exiting by whichever exit signal comes first) threads the needle between both strategies. It offers more winners than the Exit in 8 Months strategy, and the average winners outweigh the average losers by more, as well.
These are the kinds of choices and tradeoffs that every investor needs to make. There is no one-size-fits-all strategy. Some people need to have more winners than losers even if the winners are smaller. Other people are okay with having more losers than winners as long as the winners are much bigger than the losers.