
Download the KVQ research report here.
Every week, TradeSmith generates a tremendous amount of research related to stocks and funds. Our team analyzes the data to find successful investing techniques within the data. One such technique, developed after years of testing and analysis, is the concept of the Kinetic VQ.
The Kinetic VQ is based on our Volatility Quotient (VQ) — the normal volatility that any stock or fund has over a one- to three-year period.
Because volatility is dynamic, over time, a stock’s VQ will fluctuate. Typically, an increase in VQ corresponds to a time where the stock’s price is decreasing. When the VQ decreases, we can expect an increase in the stock’s price.
Knowing the stock’s VQ is helpful, but it does not give us the full picture.
That’s why we developed the Stock State Indicator (SSI) system. It helps us determine if the stock is in a healthy state and moving higher, or correcting, or even stopped out. A healthy stock will be in the SSI Green Zone while a stock in the SSI Red Zone is not in a healthy condition.
Our Kinetic VQ strategy includes the best of both worlds.
In developing the concept of Kinetic VQ, we borrowed from physics. The concept of “kinetic energy” explains the energy required to accelerate an object from a state of rest up to a given velocity.
Think about a professional baseball player. The energy he needs to generate in his body to throw a 98 MPH fast ball is his kinetic energy, which is then transferred to the baseball — ideally at just the right time.
We can think about stocks in much the same way. When a stock’s current VQ is above its normal historical VQ, and the stock is in an SSI uptrend, it acts as additional energy — much like the baseball about to leave that pitcher’s hand. That energy can propel a stock higher as the VQ returns to its normal levels and it’s what we call the Kinetic VQ.
For a stock to generate its own kinetic energy (Kinetic VQ), it needs to meet four criteria:
- The historical average VQ must be less than 40%.
- The current VQ must be at least 20% higher than the average
- The stock must be in the SSI Green
- The underlying stock must trade more than 100,000 shares
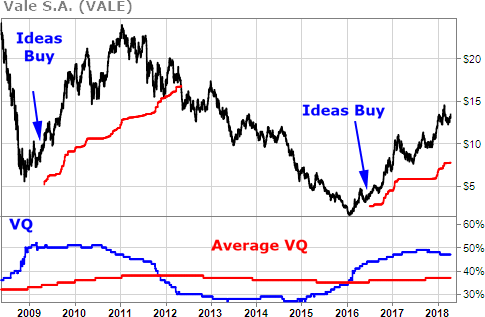
As an example, consider Vale S.A. (VALE), a Brazilian mining stock. In early 2016, VALE was trading at $4 when it entered the SSI Green Zone. The historical average VQ at that time was about 36%, but the current VQ was significantly higher at more than 45% — a difference of more than 25%. The VQ continued to climb, as did the stock. The VQ peaked at 50% in September 2017 and moved down to 40% in February 2019. The stock more than tripled in price over that time to more than $12.
To further test our Kinetic VQ theory, we took 936 stocks going back to 1999. Then, we went back and looked at the history of those stocks since 1991.
Overall, there were 829 trades that met the Kinetic VQ criteria. Here are the results, using the SSI alerts as our exit strategy. The average gain per trade — including both winning and losing trades — was 47.5%.
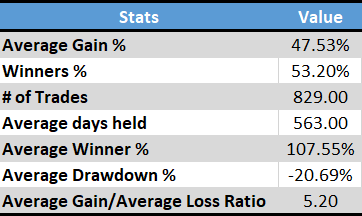
Overall, 53% of the trades were winning trades with the average winner being well over 100%. The average holding period was 563 trading days – more than 2 years of holding a position.
Here’s another example.
Back in 2015, Weight Watchers was not performing well. Membership was down, and management needed a change. This change came in the form of a new brand ambassador – Oprah Winfrey, who purchased 10% of the company. As Weight Watchers changed its focus from losing weight to healthy living, coupled with the endorsement, the stock began to surge higher.
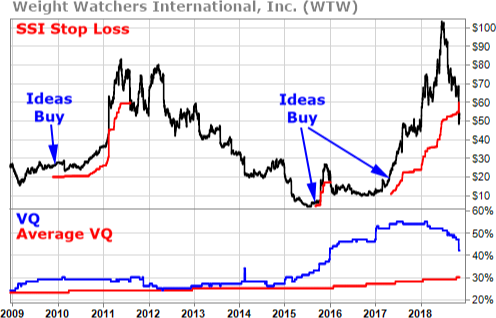
In the chart above, you can see the Kinetic VQ caught on to the initial Oprah trend, but the stock hit the SSI Red Zone shortly afterward. It was not until later into 2017 that Weight Watchers met the Kinetic VQ requirements again.
Take a look at Weight Watchers’ Kinetic VQ performance below, as compared with the S&P 500.
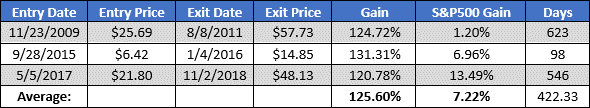
For Weight Watchers, we saw an average gain of over 125%, whereas the S&P 500 saw an average gain of 7.2%. And, our average hold time was a little over a year. Talk about built up energy and a well-timed “pitch”!
Now, because a stock with strong Kinetic VQ has a higher-than-average volatility quotient, you might want to think carefully about building an entire portfolio based on this strategy — because the stock is more volatile than we would normally expect.
The Kinetic VQ, coupled with our Stock State Indicators, can help you find stocks that are ready for multi-year runs higher with just the right timing.