
Download the full Best of the Billionaires Research Report here.
Billionaire investors are known to do extensive research before investing in a stock. We can look to the investing style of various billionaires to effectively ride the coattails of their success.
Warren Buffett looks for “intrinsic value” – the discounted value of the cash that can be pulled out of a company over the remaining life of the company.
Carl Icahn is an “activist” investor. He describes himself as a “contrarian” investor looking for companies with prices that reflect a poor P/E ratio or trading underneath book value.
Seth Klarman is a “risk-averse value investor.” He invests in heavily-concentrated stock positions as well as fixed income and real estate.
David Einhorn uses a combination of fundamental and quantitative research. He’s best-known for shorting Lehman Brothers heading into the 2008 collapse.
At TradeSmith, we’re able to analyze the investment choices of these billionaires and several others through their 13F SEC filings. We wanted to know, however, if there was any correlation between billionaires holding a stock and the success of a stock. What we found was it is not so much who but how many billionaires are holding a stock in their portfolios.
- When one billionaire owns a stock, that translates to a 55% percent win rate.
- If a stock is owned by two billionaires, the win rate goes up to 60%.
- With three billionaires, it goes to 65%!
Our analysis of these stocks can help you build a portfolio that can help you limit your risk and maximize your potential gains.
TradeSmith Billionaire Analysis Basics
We accomplish our analysis through our ranking system, the Stock State Indicators (SSI), and the Volatility Quotient (VQ).
As a reminder, the VQ tells you how volatile a stock is. In other words, it shows you the amount of fluctuation you should expect to see in a stock’s price. It can also act as a customized trailing stop for stocks. We then take 30 years’ worth of volatility data to calculate the Average VQ for a stock.
The SSI tells you the health of a stock with a simple red, yellow, green-light system. Stocks in the Green Zone are considered healthy and acting normally, while stocks in the Red Zone are acting outside their usual volatility (as measured by its VQ%) and might be best avoided. When a stock moves from the Red Zone to the Green Zone, we call this an Entry Signal.
Our analysis ranks billionaire holdings based on number of days since last SSI Entry Signal, Average VQ, and the number of billionaires that hold each position.
What Have the Results Been?
Our Best of the Billionaires strategy finds the best ideas from tracked Billionaires that:
- Are at the beginning of a new up-trend or ready to continue an up-trend
- Have the newest entry signal
- Are held by the most billionaires
We can compare the Best of the Billionaires performance against the S&P 500.
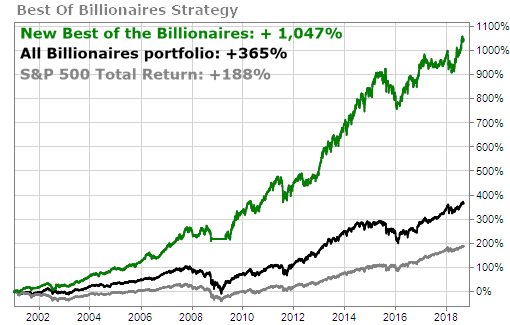
The Best of the Billionaires outperformed the S&P 500 nearly 10 times over. Even during market crashes, the technique would have helped you preserve your investments and mitigate losses. It’s inspiring to see what is possible with discipline, patience, and a little bit of research.
How Can You Potentially Achieve These Gains?
To follow the Best of the Billionaires strategy, you’d follow these steps:
- Buy the top 20 stocks in the Best of Billionaires listing. These positions have met certain requirements. They must be in the SSI Green Zone, have an Average VQ less than 40%, and cannot be trading at a loss since entry.
- If the stock hits its SSI Red Zone, exit the trade.
- Move all positions that stop out to cash for the remainder of the month.
- At the beginning of next month, rebalance the portfolio and add top Billionaires recommendation(s) to replace the stopped out positions.
You can even use this technique on individual positions. When you find a billionaire recommendation that you like, you’d position-size based on your risk tolerance and exit the position once it hits the SSI Red Zone.
As an example, let’s look at a position that was held by billionaire Bruce Berkowitz. He entered Calumet Specialty (CLMT) in mid-2006. It enjoyed a nice run-up before sharply declining in the 2008 market crash. Berkowitz didn’t exit CLMT until nearly 2010. This led to a 6% loss in the position.
Had he been following the Best of the Billionaires strategy, the story would have been much different. He would have entered the position at the start of 2009 and held it until nearly 2014.
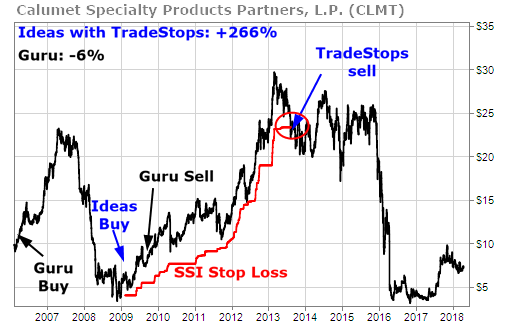
This would have led to a gain of 266%. That’s a drastic difference in performance, and it was all possible by just following the Best of the Billionaires strategy.
Another example we can consider is Bill Gates and his investment in SemGroup (SEMG). He entered this position close to July 2011 and exited about a year later. This led to a 6% gain in the trade. Not bad, right? But, let’s take a look at how the Best of the Billionaires strategy could have helped.
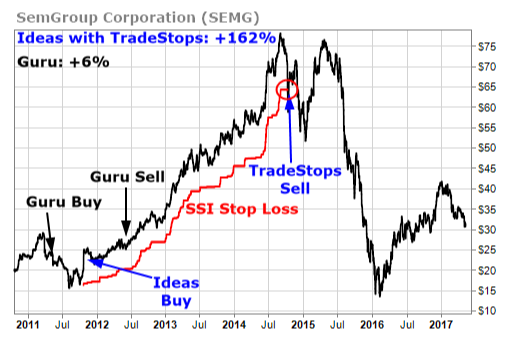
The strategy would have signaled a buy closer to the end of 2012 and wouldn’t exit until nearly 2015 for a gain of 162%.
Warren Buffett once said, “It’s not necessary to do extraordinary things to get extraordinary results.” The results we’ve discussed today are proof of that. By following the Best of the Billionaire’s Strategy, we saw gains well above the S&P 500’s total return. And, by following the techniques available in TradeSmith, it’s even possible to beat the billionaires at their own game. Buffett’s quote then holds true. You don’t need to go to extreme measures to succeed in the market. You simply need a rules-based approach with the research to back it up. The Best of the Billionaires strategy can help you do just that.